
What do you do when you have a ton of data and don’t know which are the best business intelligence tools to use to gain some valuable insights?
Well, you can take the traditional path and hire an agency or choose one of the excellent options in this article particularly designed to catapult your business into a success.
Business intelligence tools are incredibly helpful to businesses. They are already used by Fortune 500 companies and some of the most innovative startups globally.
I have compiled only the best business intelligence tools with their, cons, pros, and costs to help you choose the right one for your business.
Quick Review
What are the best business intelligence tools?
- Tableau: Best BI tool with deep features for seasoned BI pros
- Microsoft Power BI: Overall best business intelligence tool
- Dundas BI: Best simple to use BI tool
- Zoho Analytics: Perfect BI tool for existing Zoho customers
- Looker: BI solution with the most up-to-date information in real time
- Qlik Sense: Best for teams seeking simplicity in their BI
- SAS Visual Analytics: Great BI tool with real-time analytics for HANA users
- Sisense: Best BI solution with advanced features and good integrations
- MicroStrategy: Best for comprehensive reporting and best-in-class security feature
- Oracle Analytics Cloud: Best scalable BI solution for your business
- IBM Cognos Analytics: Best AI-powered BI solution for faster, more reliable data prep
- Domo: Perfect for experienced users who need lots of data connectors
See also: Best Small Business Accounting Software — Get Your Accounts in Order
Best Business Intelligence Tools to Leverage Valuable Insights
1. Tableau
Tableau is one of the best business intelligence tools that is commonly used by over a million individuals, teams, and companies all around the globe. The tool covers all bases with its BI tool: you may run it on your own servers, in the cloud, or also have it entirely hosted by Tableau.
Whether you’re a C-level executive looking to gain the edge on your competition or an analyst who wants to make data visualization fun again, Tableau is the business intelligence solution that scales on-demand from a desktop to an enterprise deployment. Additionally, it’s ultra-fast, flexible, and easy to use.
Tableau has customized versions for more than a dozen industries, including banking, healthcare, and manufacturing, as well as financial, HR, IT, marketing, and sales departments, which is almost standard these days.
Pros
- Very easy to use
- Offers free plan
- Integration with Goodle Drive
- Allows you to highlight specific data points
- Optimizes visualizations for viewing from different devices
- Compatible with mobile devices
- Installs on-premise, public cloud, and Tableau cloud
- Delivers intuitive, self-service analytics
- Integrates data from multiple sources
- Creates real-time visualizations in a few clicks
Cons
- Server administration is cumbersome
- Embedding is limited and difficult
- In order to keep your data private, you have to buy a subscription
Pricing
Tableau’s public version is completely FREE, but the desktop version costs $70 per month per person. It can be used with a Tableau Server, and you can also self-host on a private server.
2. Microsoft Power BI
Microsoft, a software juggernaut, has a business intelligence tool called Microsoft Power BI. Microsoft’s BI suite allows marketers to build interactive dashboards and also reports using interactive business intelligence features.
Unlike some of their competitors, who only offer a web-based portal, Power BI also provides downloaded software, allowing you to execute your analytics in the cloud or on a reporting server.
Additionally, Power BI comes with a sixty-day trial to test the software. It claims to “connect hundreds of data sources,” including Microsoft apps and other sources like Facebook, Sybase, and Oracle. As a result, it can prep data for future data analysis on the fly, allowing reports to be generated in minutes.
Overall, this is a powerful BI tool that provides data encryption from beginning to end and real-time access monitoring.
Pros
- Excellent API support
- Huge datasets and customizable dashboards
- Complete data visualization and reporting tools
- Drag and drop features
- Forecast predictions and trend indicators
- Extensive charting
- Ad hoc reports and analysis
- Microsoft is still investing in updates
- Multi-mode, real-time alerting based on user-defined thresholds
- Predictive analytics capabilities and embedded machine learning
- Not as expensive as other popular BI tools
Cons
- Inability to create a new dashboard in mobile app view
Pricing
Power BI is free to use as a desktop version for personal use. The team-oriented Power BI Cloud Service, on the other hand, costs $9.99 per month.
3. Dundas BI
Dundas offers a suite of Business Intelligence (BI) tools that help users to create, generate, and also present data in a way that reflects the global organizational goals. The BI tool is used by businesses who know that having access to the latest data is crucial for staying competitive in their industry.
Dundas solutions are designed for the widest range of users, on-premise or in the cloud. From business users who make decisions based on data to IT professionals responsible for deploying and managing solutions.
You can examine data without involving IT by incorporating data files using drag and drop capabilities. It may also be utilized on several platforms, including mobile ones, thanks to the HTML5 interface.
Overall, Dundas BI helps companies transform businesses by connecting people with real-time information.
Pros
- Web-based server application
- Allows access via both web and mobile devices
- Integrates data from multiple sources
- Uses a self-service approach to generate reports and visuals
- Adapts to user skill levels
- Offers drag and drop tools
- Creates personalized visualizations and reports
- Delivers real-time data analysis
Cons
- Steep learning curve
- No predictive analysis features
- Data cube nodes cannot be copied
Pricing
Dundas BI claims to offer a custom plan that’s perfect for your business. Thus, you need to contact them for a quote based on your BI needs.
4. Zoho Analytics
It has an automatic data synchronization function that allows companies to examine data from any source. You can use spreadsheets and flat files, as well as online storage facilities, to upload data.
You can also connect to a variety of relational databases, whether on-premises or in the cloud. It is driven by Zia, a smart analytical assistant that combines NLP and machine learning to aid marketers in gaining insights in minutes.
Dell, Tesla, HP, Ikea, and Canon are among the companies that use Zoho Analytics. The dashboard offers a combination of key metrics across all your business processes. It is accessible anywhere, anytime on any device which offers you a seamless experience.
Zoho Analytics is a single solution that gives you access to all of your business data in one place so you can make smarter decisions at the speed of light.
Pros
- Access to on-premise, mobile, and cloud
- Requires minimal expertise
- Collects data from multiple sources
- Synchronizes automatic data feeds
- Provides drag and drop tools
- Shares reports and dashboards through the web page and app
- Provides a workspace for collaboration
Cons
- Limited types of graphics available
- Outdated dashboard design
- Setup can be a little difficult
Pricing
Pricing for Zoho Analytics starts at $22 (Basic) and goes up to $445 (Enterprise). You can, however, test it for free for 15 days.
5. Looker
Looker is one of the best business intelligence tools that gives you instant access to the data driving your business. It makes it easier to find, access, and understand data in critical areas like finance, marketing, sales, and HR.
By integrating different data sets, tracking cross-channel consumer behavior, and segmenting customers by characteristics, businesses may obtain deeper insights into their customers.
Looker enables organizations to measure key performance indicators (KPIs) such as CPC, CTR, and CPA, as well as analyze the spending and income produced by each campaign and marketing medium. Additionally, you can set up custom rules to get email notifications when a strategy or ad fails.
It also enables cross-channel attribution analysis, which allows marketing managers to see trends in consumer behavior.
Pros
- Installs on-premise or in a Looker-hosted cloud
- Connects to use SQL database or data warehouse
- Provides a proprietary LookML syntax for query optimization
- Offers drag and drop features for dashboard creation
- Creates real-time visualizations available on all devices
- Exports visualizations for collaboration with others
Cons
- Limited onboarding support
- Can be slow sometimes
Pricing
Unlike some options on this list, Looker has quote-based pricing, so you’ll have to contact them for further information.
6. Qlik Sense
Leading businesses around the globe use Qlik Sense to turn their data into actionable intelligence.
Qlik Sense is a business intelligence platform for self-service data visualization, exploration, and discovery. Sense unlocks your organization’s data for real-time access, rapid decision making, and long-term insights.
Qlik’s objective is to allow anybody in the company access to all of the company’s data, according to corporate data governance standards, of course.
Well, all of that data should be enough to slow down most database engines. However, Qlik claims that its Associative Engine can associate every item of data with every other piece to make finding connections simpler.
Additionally, the Associative Engine now includes AI and machine learning capabilities that provide context-aware insight suggestions.
Pros
- Allows on-premise, mobile, and cloud access
- Collects data from on-premise and cloud sources
- Requires little specialized expertise
- Provides a unified interface for gathering and manipulating data
- Assists users with AI-driven suggestions to create analytics
- Creates click-and-go visualizations and interactive reports
- Centralizes analytics and apps to enable collaboration
- Allows advanced analytics calculations from R and Python
Cons
- A bit pricey
- Limited customization options
- Can’t handle large data
Pricing
For $30 per month, you can use Qlik Sense. However, you will need to contact the sales team to inquire about the enterprise plan. Qlik Sense also provides a free trial so you can try out the software.
7. SAS Visual Analytics
With SAS Visual Analytics, you can easily create visualizations and dashboards that link to your data sources. The intuitive interface lets anyone on your team interact with data to visualize information, ask questions about it, and formulate hypotheses for action.
Also, you can easily transform data into insight for better decisions faster. It’s a great tool for business analysis, with the power of SAS combined with an easy-to-use design and reporting tools.
Particularly designed for users with limited or no statistical expertise, SAS Visual Analytics enables end-users to perform sophisticated analysis on large data sets and visually interpret datasets via intuitive graphical representations.
Also, deployment options include on-premises, in public or private clouds, or as a service on the Cloud Foundry platform.
Pros
- Create portfolio dashboards for different lines of business
- Self-service analytics
- Simple to use with mostly drag and drop
- Stock market analysis.
- Resource utilization and optimization
- High performance and scalability
- Supports a high volume of users simultaneously with ease
- ETL capability and data preparation feature
Cons
- Can’t export dashboard reports to multiple formats with original format intact
- Sorting with values not used in a chart or table
Pricing
Like Looker, SAS Visual Analytics pricing is also quote-based. Therefore, you will have to reach out to their sales team. Also, SAS Visual Analytics offers a free trial.
8. Sisense
Sisense in-chip database engine is quicker than in-memory databases, and its BI software stack includes everything from the database through ETL, analytics, and visualization. It’s particularly recognized for its application in embedded business intelligence.
Also, new machine learning capabilities have been added to the current edition. Sisense can be installed locally or in the cloud. Sisense also allows people outside the company to use analytics tools by integrating them into web apps.
Overall, with Sisense you can ask questions about your data and make better sense of insights, enabling you to act quickly on real-time business opportunities and have greater visibility into potential problems.
Pros
- Easy to use
- Employs a proprietary chip to drive fast data analysis
- Scaleable for increases in users and datasets
- Integrates data from many sources
- Simplifies workflow creation
- Interactive dashboards with real-time data
- Provides insights and visualizations across platforms and devices
- Creates advanced analytics
- Customer support is straightforward and well responsive
Cons
- Few operational metrics on dashboards
- Windows servers are required for Sisense installation
- The mobile version isn’t comprehensive as the desktop version
Pricing
Prices are not listed on Sisense’s website. Therefore, you will need to get a customized quote based on your unique needs.
9. MicroStrategy
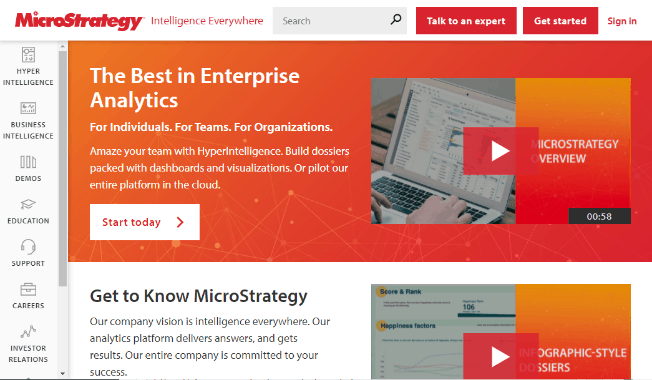
MicroStrategy’s cloud, on-premises, and hybrid deployment solutions target the enterprise BI market across a wide range of sectors. You can customize data visualizations and build real-time dashboards with a drag-and-drop interface.
Additionally, MicroStrategy promotes federated analytics, which allows clients to make use of their existing investments in data sources, and combine the data to create reports and insights.
It also includes an enterprise semantics graph, which indexes data assets and adds location intelligence and real-time telemetry to data silos. MicroStrategy offers a 30-day free trial of its entire platform.
Overall, from business intelligence analysts and data scientists to business executives and IT professionals, MicroStrategy is a BI tool made for all.
Pros
- Online Analytical Processing capabilities
- Create personalized dashboards
- Excellent customer support
- Centralized dashboards
- Real-time data analytics
- Highly customizable
- Reports are completely responsive to different devices
Cons
- Offer limited implementation support
- Interface isn’t intuitive
- Steep learning curve
Pricing
MicroStrategy has no prices listed on its website. Therefore, you will need to request a quote based on your unique needs.
10. Oracle Analytics Cloud
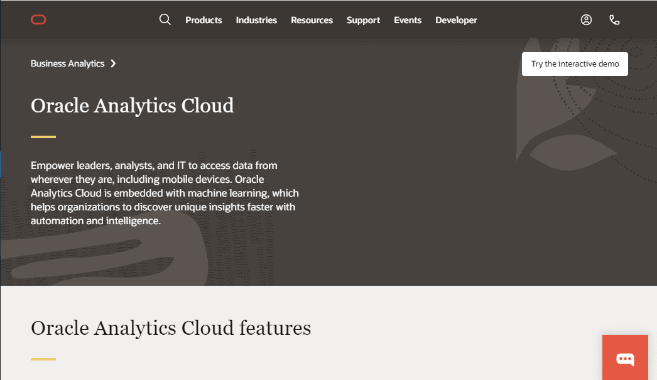
Oracle Analytics Cloud is a comprehensive set of business intelligence tools available within the cloud. As an outgrowth of its flagship suite Business Intelligence Enterprise Edition, Oracle Analytics Cloud was launched in 2014.
In 2020, it introduced a Cloud HCM solution to empower HR executives, analysts, and line-of-business leaders with self-service workforce analytics.
Oracle’s cloud solution is particularly designed to be straightforward and user-friendly, with sophisticated reporting and machine learning capabilities. Data preparation, visualizations, predictive analytics, a native mobile app, and embedded analytics support are all key aspects.
In general, with these industry-leading, cloud-based analytics tools, you can make smarter decisions to inspire action and foster better relationships that grow your business.
Pros
- Allows replication of the database from fusion ERP
- Use artificial intelligence in data analysis
- Easy to learn and navigate
- Real time reporting
- Easy to import any type of data
- Highly customizable
- Access data and analytics from mobile devices
- High-speed connection to a wide range of data sources
- Excellent customer support
Cons
- Lack integration with Excel
- Takes a long time to generate a data model
Pricing
Prices are not listed on the website. Therefore, you will need to contact the sales team to get a customized quote based on your needs.
11. IBM Cognos Analytics
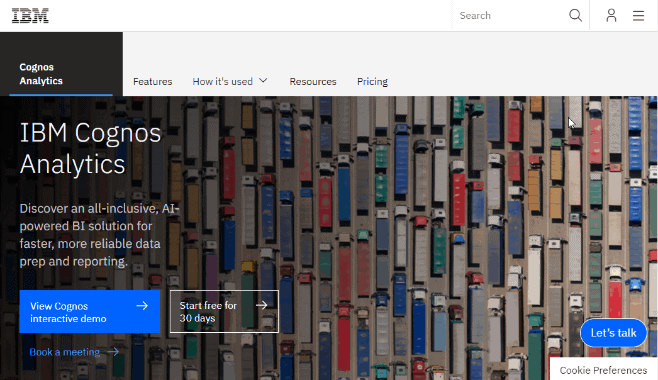
IBM Cognos Analytics delivers a powerful combination of business intelligence software, services, and content for companies who want to gain insight from their data and make better business decisions.
Whether you want to analyze competitive market trends, gain visibility on operational performance or optimize operations, IBM Cognos Analytics offers the best solution to meet your specific needs.
Using multiple views-from graphical analytics to semantic discovery, you can automatically uncover deep insights from your data and share those insights with your team using consistent visualization tools.
Overall, IBM Cognos Analytics enables decision-makers to easily discover hidden insights, act on them immediately to improve performance and ensure consistency across your organization.
Pros
- Installs on-premise or in the cloud
- Allows access on-premise or via cloud
- Requires no specialized expertise
- Shares reports and dashboards through a web page
- Shares visualizations over email or Slack
- Imports data from all types of sources
- Uses machine learning to assess and combine related sources
Cons
- Designed only for small businesses
- Minimal forecast capabilities
Pricing
In addition to its generous 30-day free trial, IBM Cognos Analytics provides 3 affordable paid plans, including:
- On Demand: Starts at $10
- On Cloud Hosted: Starts at $5
- Client Hosted: Starts at $5
12. Domo
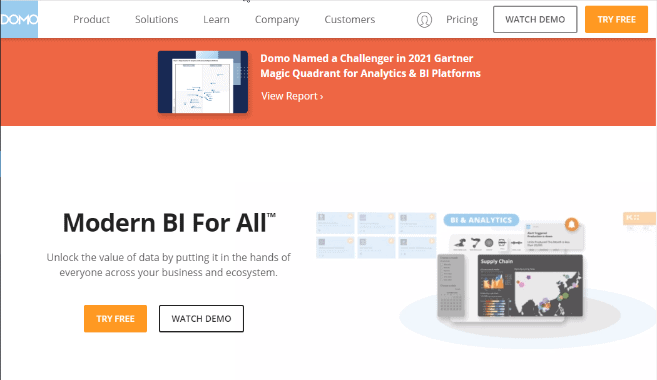
Domo simplifies the overwhelming complexity of business intelligence. With this one product, your team will have the best tools to capture, organize, and analyze all types of data. Everything you need in one place. The data you need to succeed.
Domo is a business intelligence platform that consists of several systems, starting with data connectivity and ending with data extension via pre-built and bespoke applications from the Domo Appstore.
You can use Domo in conjunction with R or Python scripts to prepare data for predictive modeling in data lakes, warehouses, and ETL tools.
You can also link data throughout your organization, leverage machine learning, and artificial intelligence capabilities, and allow people to explore the data on their own.
Pros
- Allows access via web and mobile devices
- Connects all data sources
- Monitor company data on the go at any time
- CRM data and web analytics
- Excpetional customer support
- Requires no technical expertise from users
- Provides drag and drop features for data integration
- Creates real-time visualizations
- Can export visualizations for collaboration with others
Cons
- Processing could be slow for very large datasets
- Pivot table functionality is limited
Pricing
Prices are not listed on Domo’s website. Therefore, you will need to get a customized quote based on your unique needs.
What is Business Intelligence (BI)?
Business Intelligence (BI) is a term that is used to describe the implementation of new technologies and tools that improve business decision-making by producing actionable information for the end-user.
Everyone can benefit from being smarter, and business intelligence (BI) is all about making the smartest decisions possible. However, dealing with data can be challenging.
Business Intelligence Tools make it easy to take your data and turn it into meaningful, powerful insight. They’re a way for everyone in your company to talk about goals, identify trends, and make smart business decisions with confidence.
In summary, BI enables organizations to derive meaning from multiple complex data sources to make business decisions quickly, efficiently, and effectively.
Why is Business Intelligence Important?
The right information at the right time is powerful. It can tell you what your next best steps are. That’s the promise of Business Intelligence – BI.
A rational system that pulls together data from any source, analyses it and presents the results to an audience of one or many. Access to information that helps you make the best decisions possible is vital to running your business effectively and achieving your goals.
BI is a modern term for business analytics; it has been around almost as long as commerce itself. BI solutions offer valuable insights while simplifying operations and reducing costs.
Below are a few examples of how business intelligence may assist you in making better, data-driven decisions:
- Identify ways to increase profit
- Analyze customer behavior
- Compare data with competitors
- Track performance
- Optimize operations
- Predict success
- Spot market trends
- Discover issues or problems
See also: Best Small Business Loan Providers — Invest More in Your Business
FAQs
What criteria should I use to decide on a tool?
There are several points to consider when deciding on which business intelligence tool to use. For example, you might want to focus on your company’s exact data needs, the business intelligence tools that are actually available or the ones that your IT department has budgeted for in its strategic plan.
In addition, the skills and experience of IT staff, particular limitations about how you use your data or analyze it, etc.. are some other key factors.
However, in summary, there are 4 aspects to consider when choosing a business intelligence tool: Creation, Retrieval, Analysis, and Presentation. Also, another important factor of a BI tool is scalability. The tool you choose should be able to scale your needs, as they grow and change over time.
How long should a dashboard take to make?
Well, the time it will take to create a dashboard will depend on the BI tool you use and the size of your data. For example, creating a dashboard on Microsoft Power BI can take between 5 – 10 minutes.
Conclusion
Overall, for its excellent usability, top-notch data visualization features, and seamless integration with other Microsoft Office products, Microsoft Power BI is the best business intelligence tool.
Microsoft Power BI is the smart way to visualize and analyze your data and deliver a high-value experience that allows you to keep pace with your world. With Power BI, you get powerful, flexible, and easy-to-use business intelligence tools across all of your devices and platforms.
Finally, customers are the lifeblood of your business. If you’re serious about growing your business, getting more quality leads, and converting them to paying customers, you need a reliable email marketing service. Here are the Best Email Marketing Services To Grow Your Business Today.
I hope you found this post helpful.
Alapere helps you in choosing the right tools to grow your business, operate efficiently and make more sales.
Thanks for reading.
Ready to Try Microsoft Power BI For FREE?
Click on the button below to get started with Microsoft Power BI for free.